Graphs
[[Graphs]]
- Knotis builds three graphs:
- [[Site graph]],
- [[Page graph]], and
- [[Concept graph]].
- Graphs turns a site into a map of connected pages and concepts.
- Graphs are generated by the [[wikilink|wikilinks]] and,
- The [[outlining|outline]] defines the graph hierarchy.
[[Site graph]]
-
The site graph shows the whole course at a glance.
- Every page is a node, linked by shared concepts and navigation order.
- It has its own page in the site, so users can open the site graph at any time.
-
Site graph: Nodes - Lines - Search - Filtering
- Nodes:
- Section nodes: Top-level sections (for example Modules, Resources).
- Page nodes: Each page.
- Concept nodes: Every wikilink in the course.
- Larger circles mean the concept appears on more pages.
- Lines:
- Section → page: Site navigation.
- Page → concept: The concepts mentioned on that page.
- Concept → concept: Parent/child structure.
- Search:
- Concepts are searchable in the site graph.
- Filtering:
- By default, it shows "all" pages.
- It can be filtered by the [[page tags]].
- Nodes:
Browsing [[site graph]]
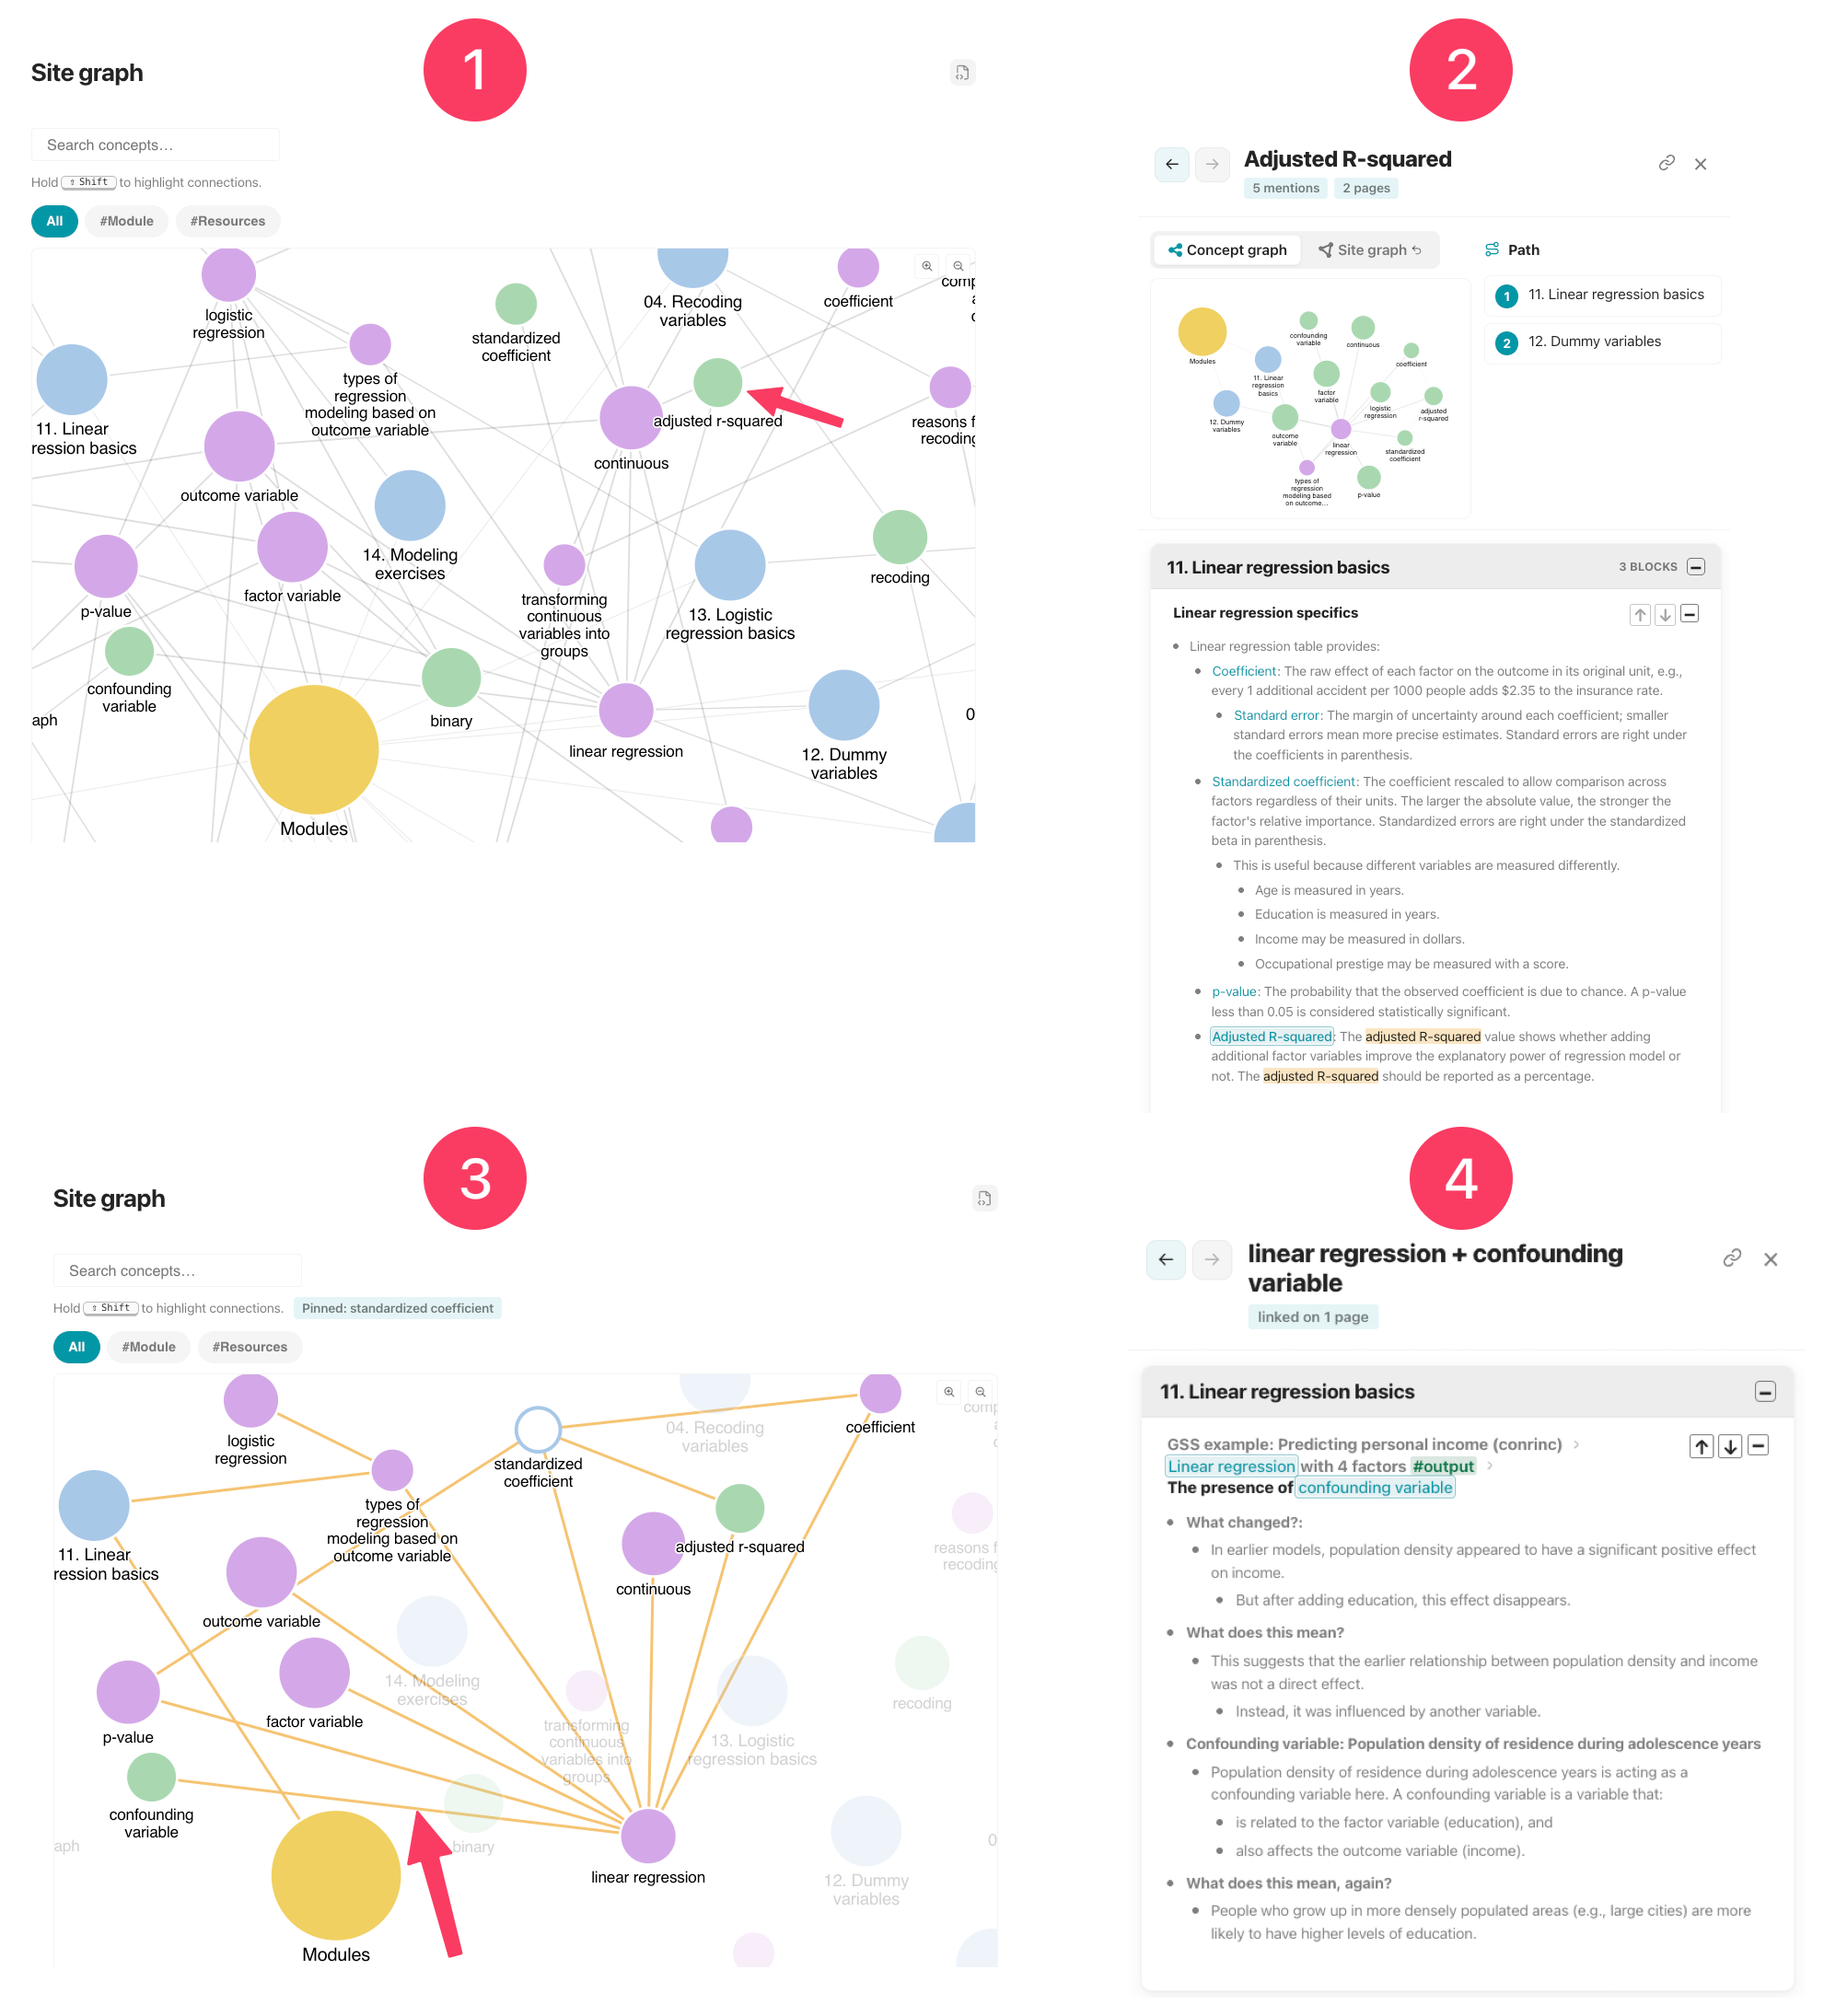
- The default view. The user clicks on "adjusted r-squared".
- The pane opens with:
- "Adjusted R-squared" [[concept graph]].
- Its [[path]], showing the two pages mentions this concept.
- The context.
- This time, the user hovers "standardized coefficient" and holds Shift to highlight its connections.
- This is the [[concept graph]] of "Adjusted R-squared" within the site graph.
- When a site graph freeze is active, sibling concept links appear. Sibling links are normally hidden from the base site graph.
- Just like in any graph, the links are clickable. The user clicks the link between "confounding variable" and "linear regression."
- This is the [[concept graph]] of "Adjusted R-squared" within the site graph.
- The pane opens the context where "confounding variable" and "linear regression" are mentioned together.
[[Site graph]] #settings
-
Site graph is customized in [[zensical.toml]] file.
-
- Line 2: Default is
true.falseturns the site graph feature off. - Line 3: Default is
all. [[Page tags]] can be used here. - Line 4: Page tags can be excluded here.
- Line 5: Sections or pages to remove from the site graph.
- Line 6: Wikilinks to remove from the site graph.
- Line 2: Default is
-
[[Page graph]]
-
The page graph is for active page only.
- It shows the concepts on the page and how they relate to each other.
-
Page graph: Nodes - Lines
- Nodes:
- Page node: Active page.
- Concept nodes: Every wikilink in the page.
- Larger circles mean the concept receives many links from other concepts.
- Lines:
- Page → concept: The concepts mentioned on that page.
- Concept → concept: Parent/child/sibling structure.
- Nodes:
Browsing [[page graph]]
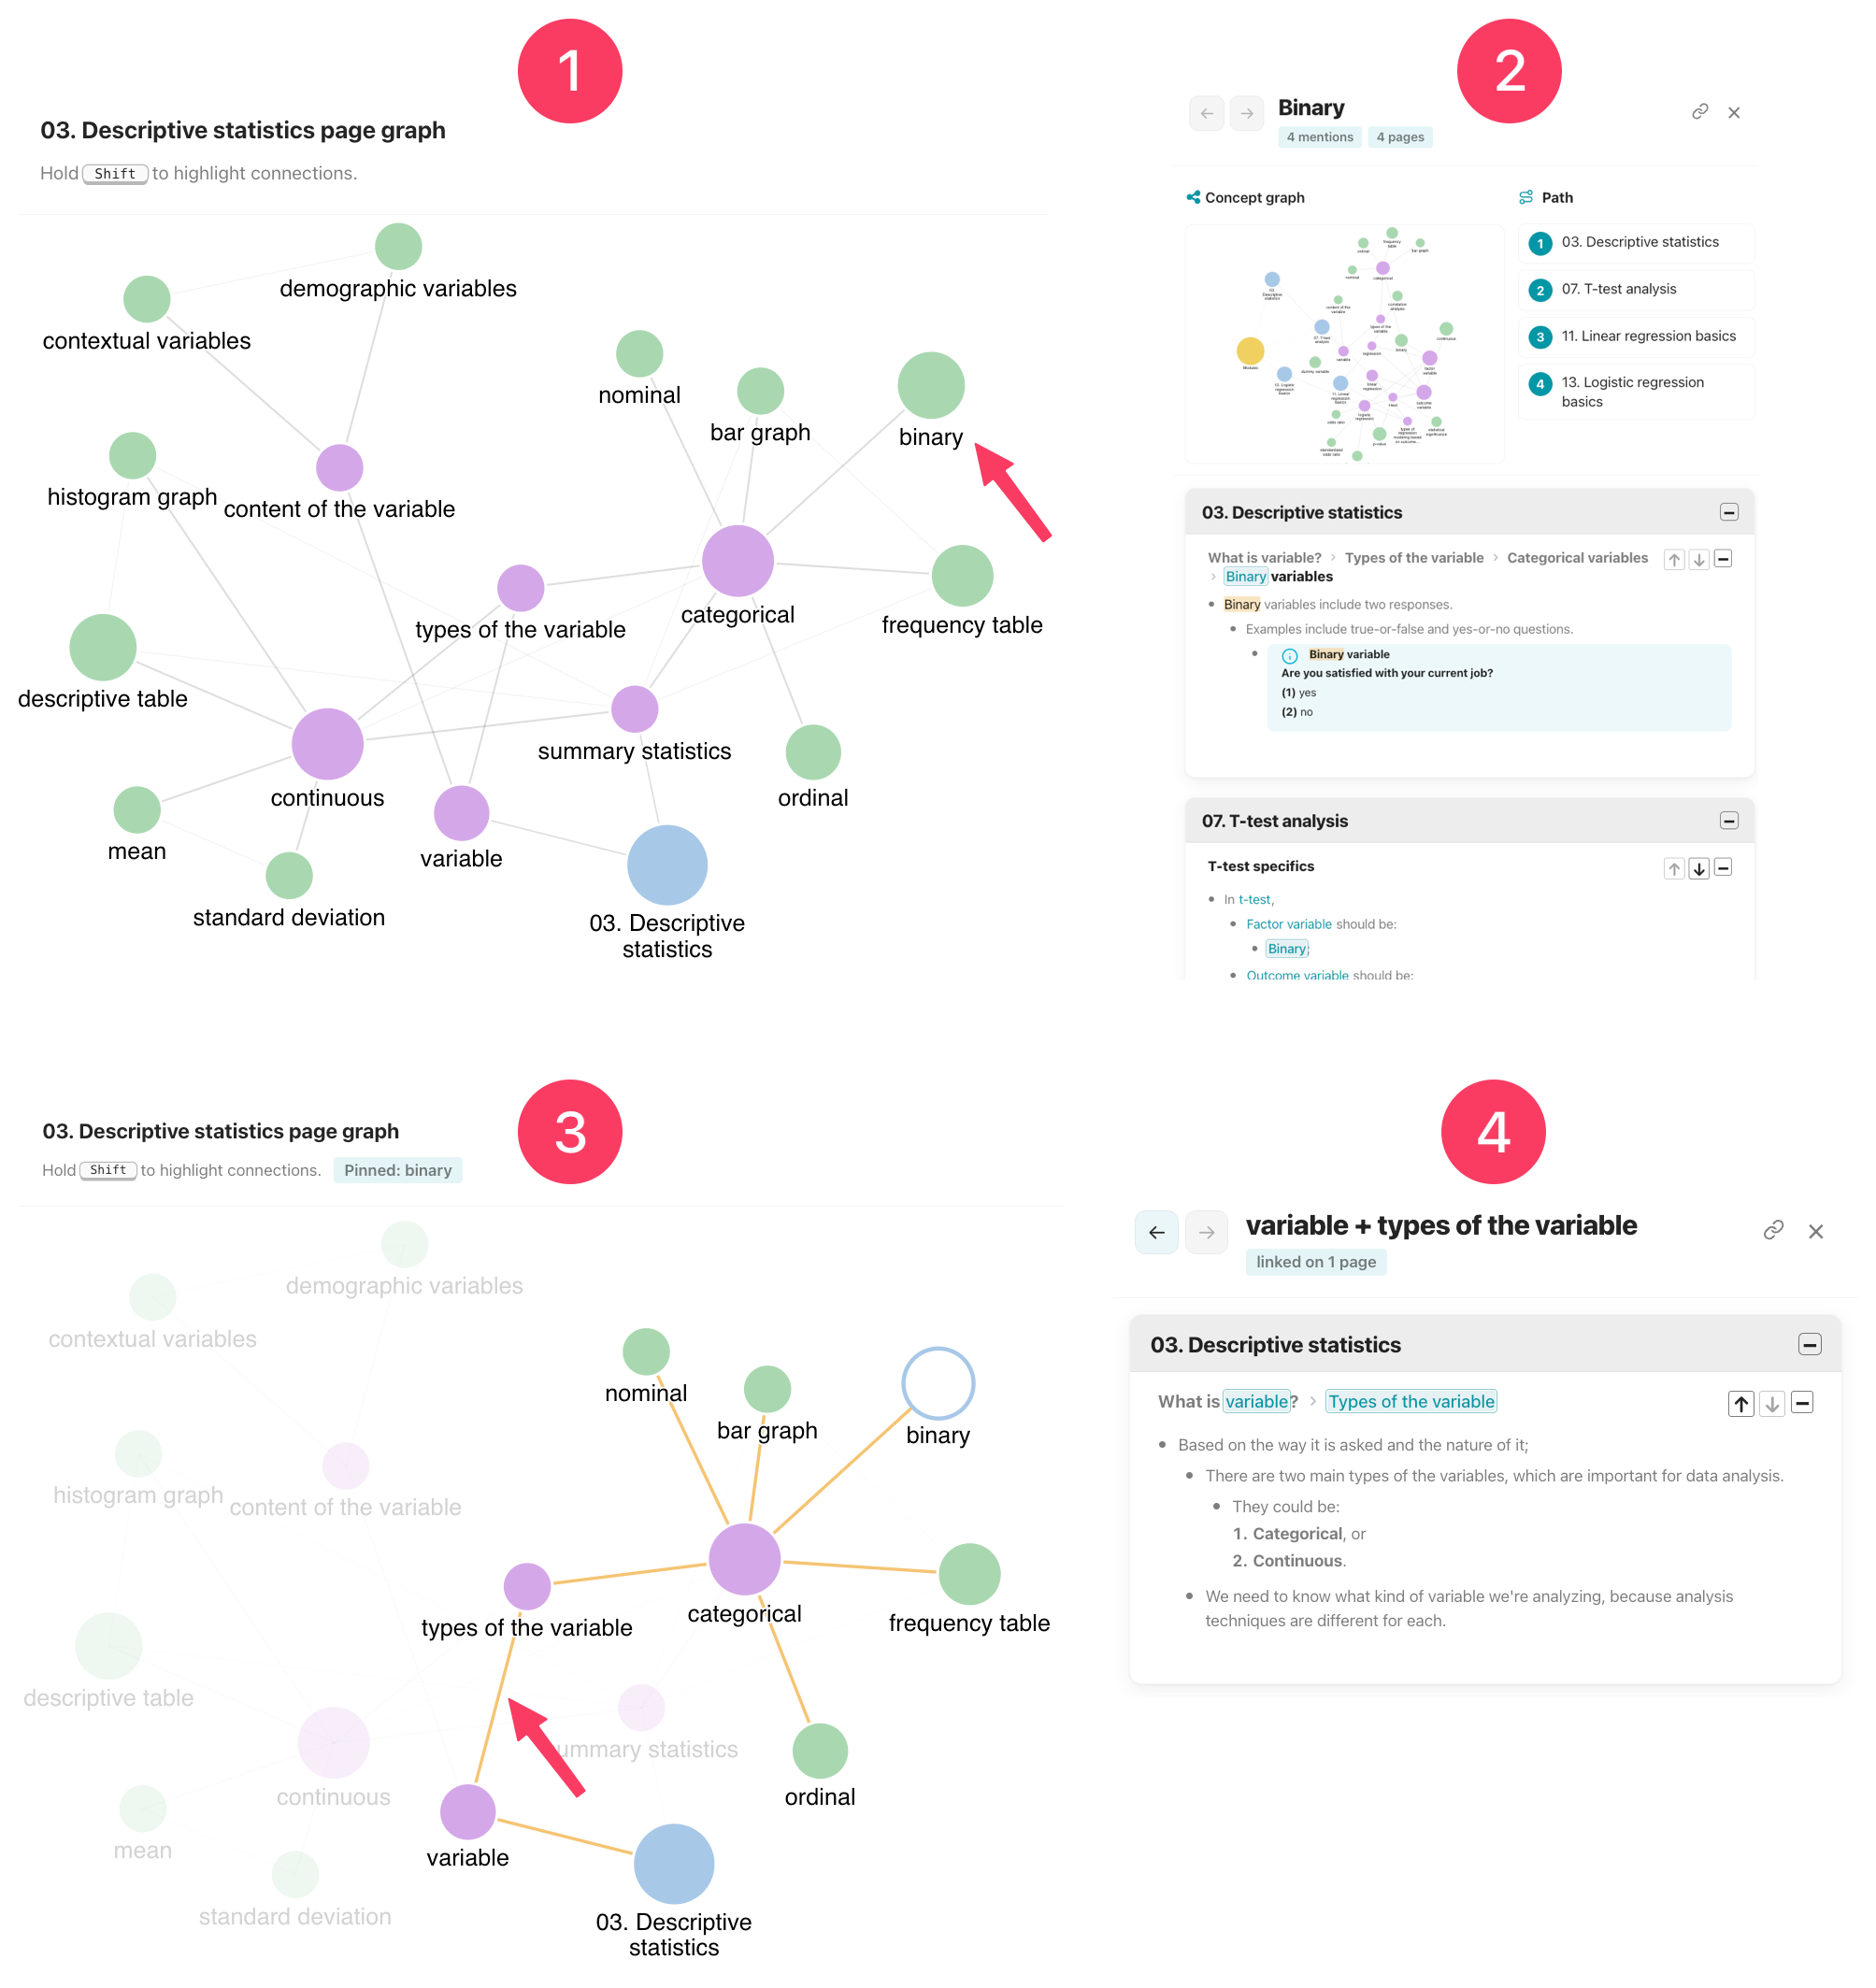
- The user opens a page, which shows the page graph preview at the top right corner.
- The user clicks that graph and clicks on "binary."
- The pane opens with:
- "Binary" [[concept graph]].
- Its [[path]], showing the four pages mentions this concept.
- The context.
- This time, the user hovers "binary" and holds Shift to highlight its connections.
- This is the teaching path of this specific concept within the page. The hierarchy between the concepts shows this path.
- Just like in any graph, the links are clickable. The user clicks the link between "variable" and "types of variable."
- The pane opens the context where these two concepts mentioned together.
- The user opens a page, which shows the page graph preview at the top right corner.
[[Page graph]] #settings
-
Site graph is customized in [[zensical.toml]] file.
-
- Line 2: Default is
true.falseturns the page graph feature off. - Line 3: Sections or pages that will not show page graph.
- Line 4: Wikilinks to remove from the page graph.
- Line 2: Default is
-
[[Concept graph]]
-
The concept graph centers on one concept.
- It shows that concept's neighbors, the ideas it is mentioned alongside.
- A small preview appears inside every [[pane]]. Clicking through opens the full view.
- It shows that concept's neighbors, the ideas it is mentioned alongside.
-
Concept graph: Nodes - Lines
- Nodes:
- Page nodes: Pages that mention the concept.
- Concept nodes: Every wikilink that has connection with the concept
- Larger circles mean the concept receives many links from other concepts.
- Lines:
- Page → concept: The concepts mentioned on that page.
- Concept → concept: Parent/child/sibling structure.
- Nodes:
Browsing [[concept graph]]
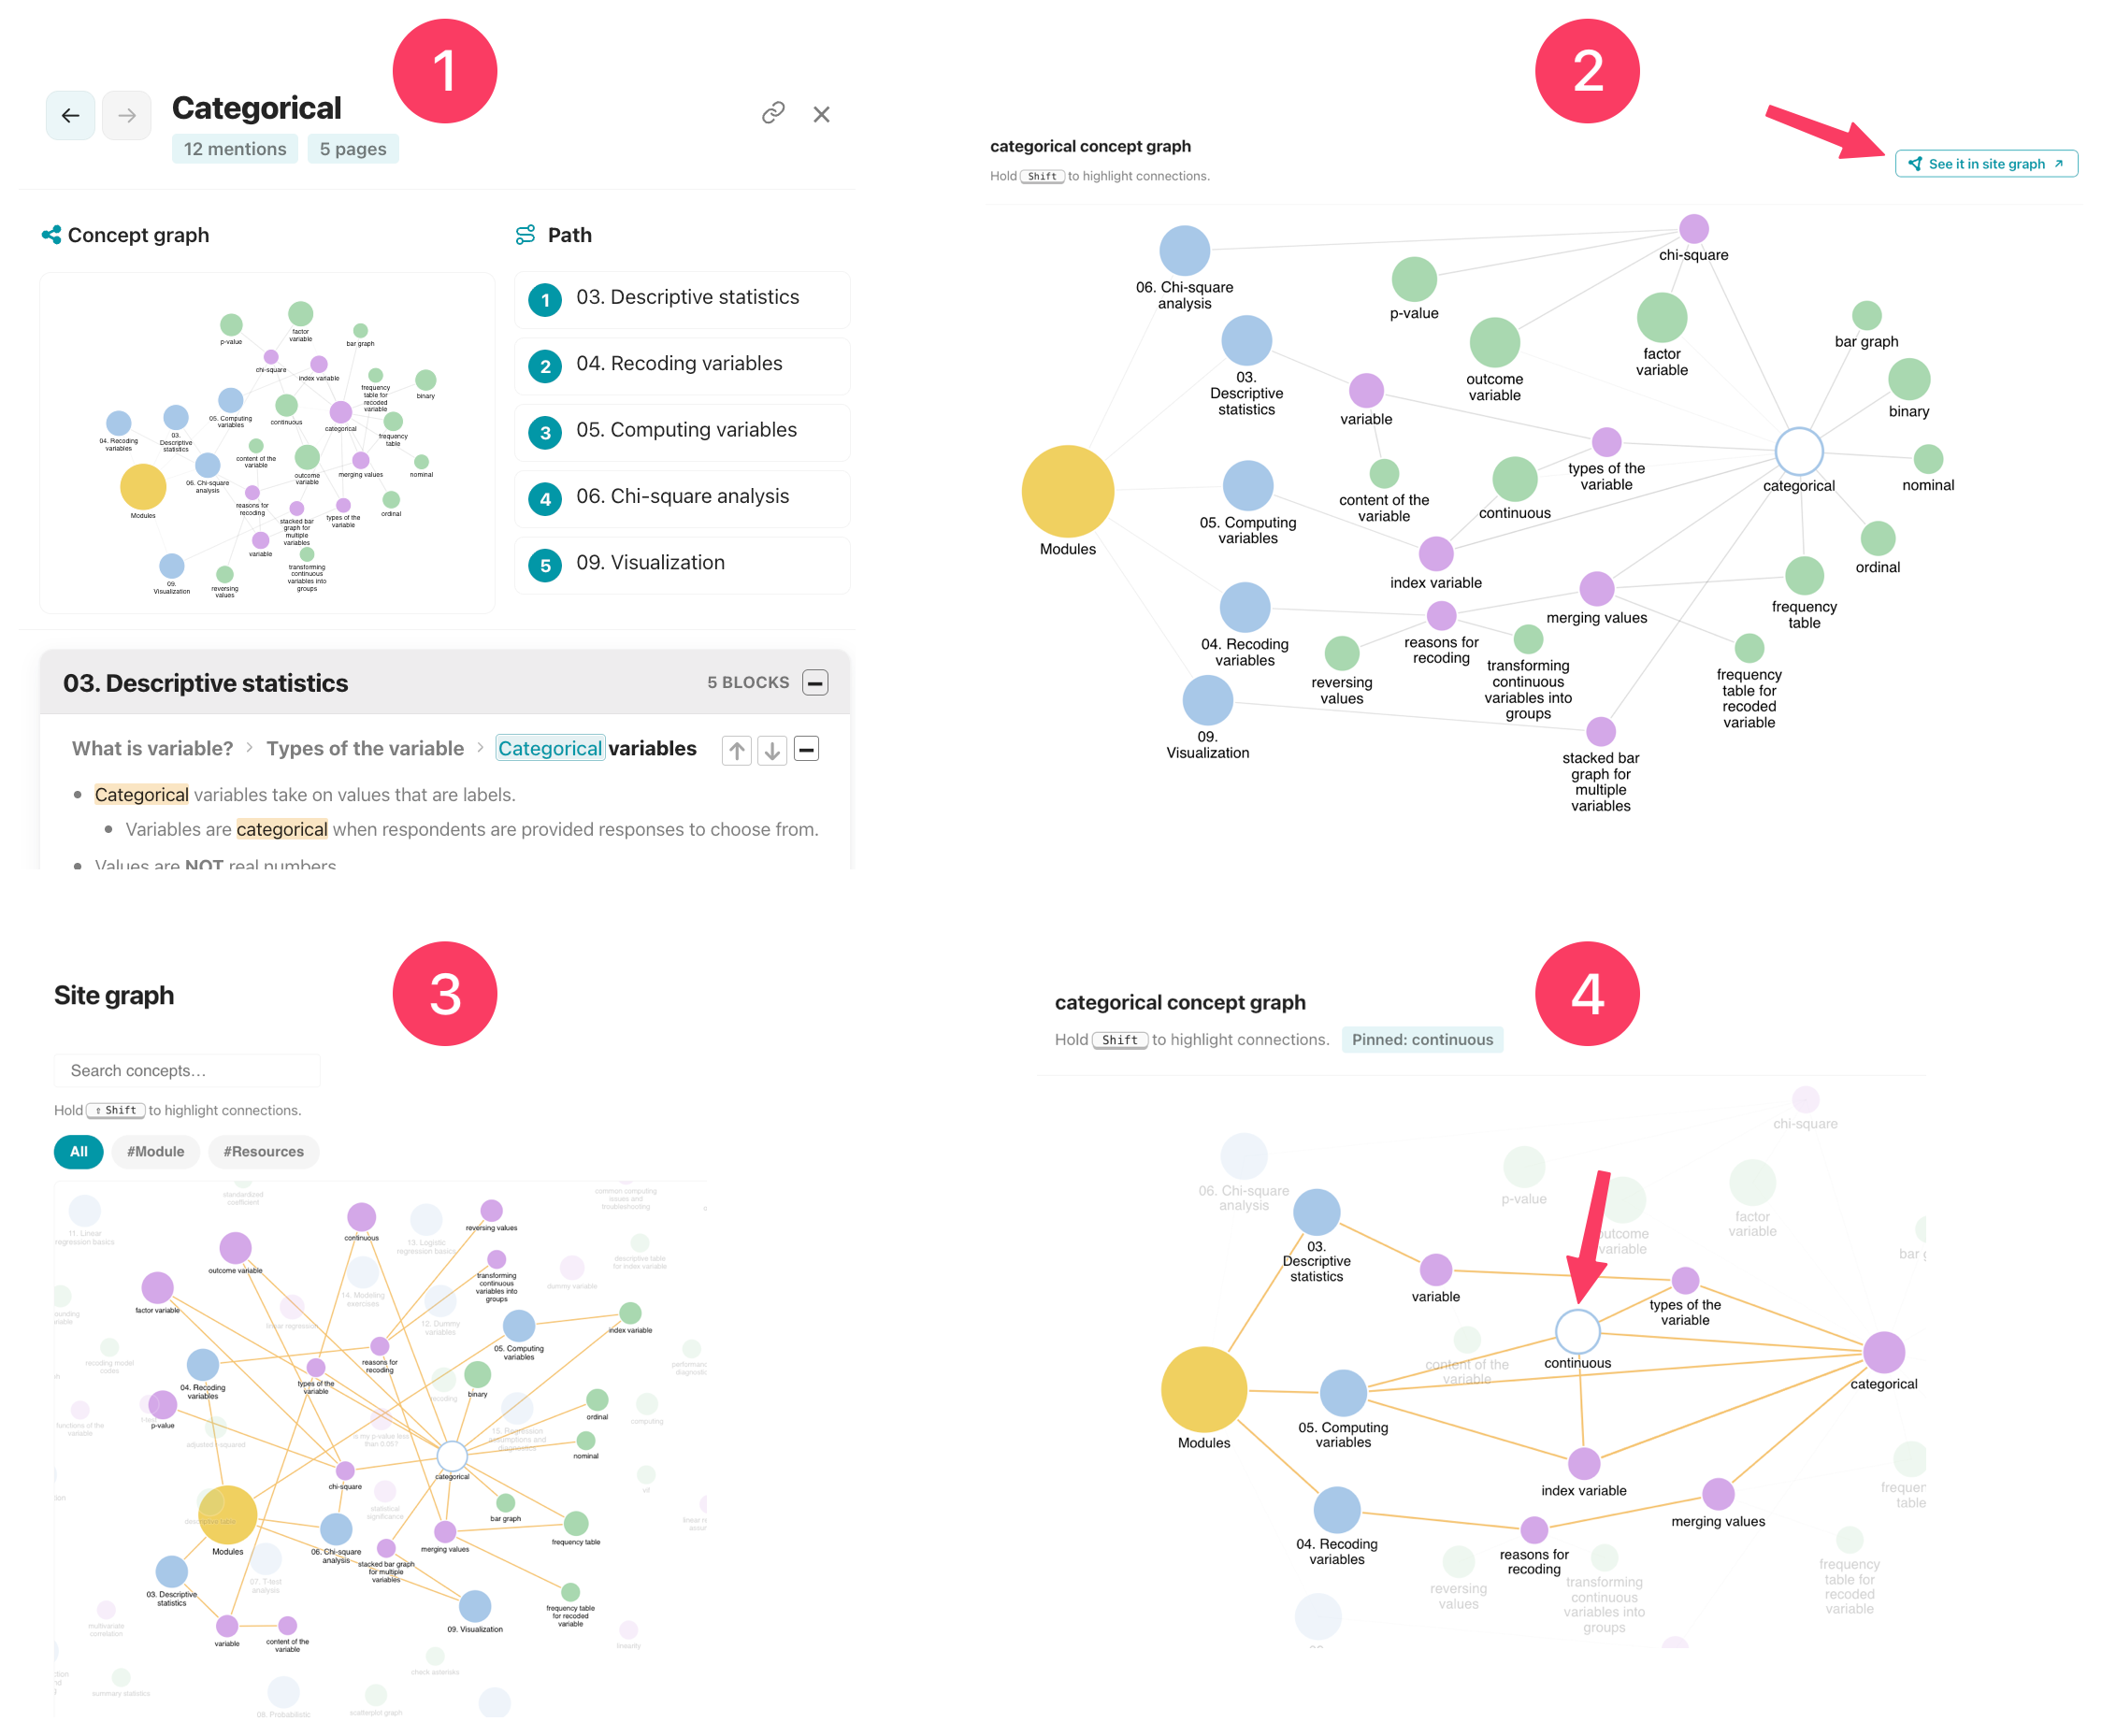
- The user clicks on "categorical" on a page, graph, pane, or glossary. The pane opens with:
- "Categorical" [[concept graph]].
- Its [[path]], showing the five pages mentions this concept.
- The context.
- The user clicks on "Concept graph" preview.
- The concept graph shows all the pages, concepts, and links involved "categorical."
- The user clicks "see it in site graph".
- The [[site graph]] opens. It automatically freezes the concept.
- This is the concept graph within the site graph.
- The user clicks on the concept in the site graph, hovers "continuous" and holds Shift to highlight its connections.
- This is the teaching path of "categorical" and "continuous" together across the pages.
- The user clicks on "categorical" on a page, graph, pane, or glossary. The pane opens with:
[[Concept graph]] #settings
-
Concept graph is customized in [[zensical.toml]] file.
-
- Line 2: Default is
true.falseturns the concept graph feature off. - Line 3: Sections or pages that will not show concept graph.
- Line 4: Wikilinks to remove from the concept graph.
- Line 2: Default is
-